

[ad_1]
Stacker ranked each state—and the District of Columbia—by the total property damage due to summer weather events from 2013 to 2022, using NOAA data.
– Canva
Nicole Caldwell
With summer weather comes the sun, more daylight, and rumbling midday thunderstorms, but occasionally, the scales tip toward the extreme.
As climate change warms the planet, the dog days of summer increasingly bring extreme weather conditions. Climate change exacerbates weirder-than-normal weather, interfering with ocean currents, lending extra heat to tornadoes, extending droughts, and intensifying floods.
Heatwaves between 1961 and 2021 increased in duration, frequency, and intensity, according to data from the Environmental Protection Agency. The amount of heavy torrential downpours has also been rising, especially since 1991. In some regions, including the Northeast, Midwest, and Great Plains, downpours are more than 30% above the 1901-1960 average. The reason for the uptick? Warm air contains more water vapor than cold air, so excess moisture finds its way into storm systems, causing more torrential rain.
While more severe summer weather affects all of us, certain parts of the United States bear the brunt of these changes. Miami’s summer heat and humidity are particularly intense: The city ranks among the top 10 cities most likely to be hit by a tropical storm or a hurricane. Meteorologists also recommend avoiding New Orleans; Dallas; Mobile, Alabama; and Corpus Christi, Texas, during the summer months.
Stacker ranked each state—in addition to the District of Columbia—by the total property damage due to summer weather occurrences from 2013 to 2022, using the National Oceanic and Atmospheric Administration’s Storm Events Database. A weather event was classified as having occurred in the summer if it happened in June, July, or August.
Read on to find out which states are right in the eye of the storm.
![]()

Real Window Creative // Shutterstock
#51. Delaware
– Annual average property damage: $70,204
– Annual property damage per 100K people: $6,893.6
– Most damaging disaster type: Thunderstorm winds ($39,200 in annual damage)

Sean Pavone // Shutterstock
#50. Oregon
– Annual average property damage: $371,150
– Annual property damage per 100K people: $8,753.3
– Most damaging disaster type: Wildfires ($230,000 in annual damage)

George Wirt // Shutterstock
#49. Rhode Island
– Annual average property damage: $289,200
– Annual property damage per 100K people: $26,441.5
– Most damaging disaster type: Tropical storms ($185,210 in annual damage)
Kevin Ruck // Shutterstock
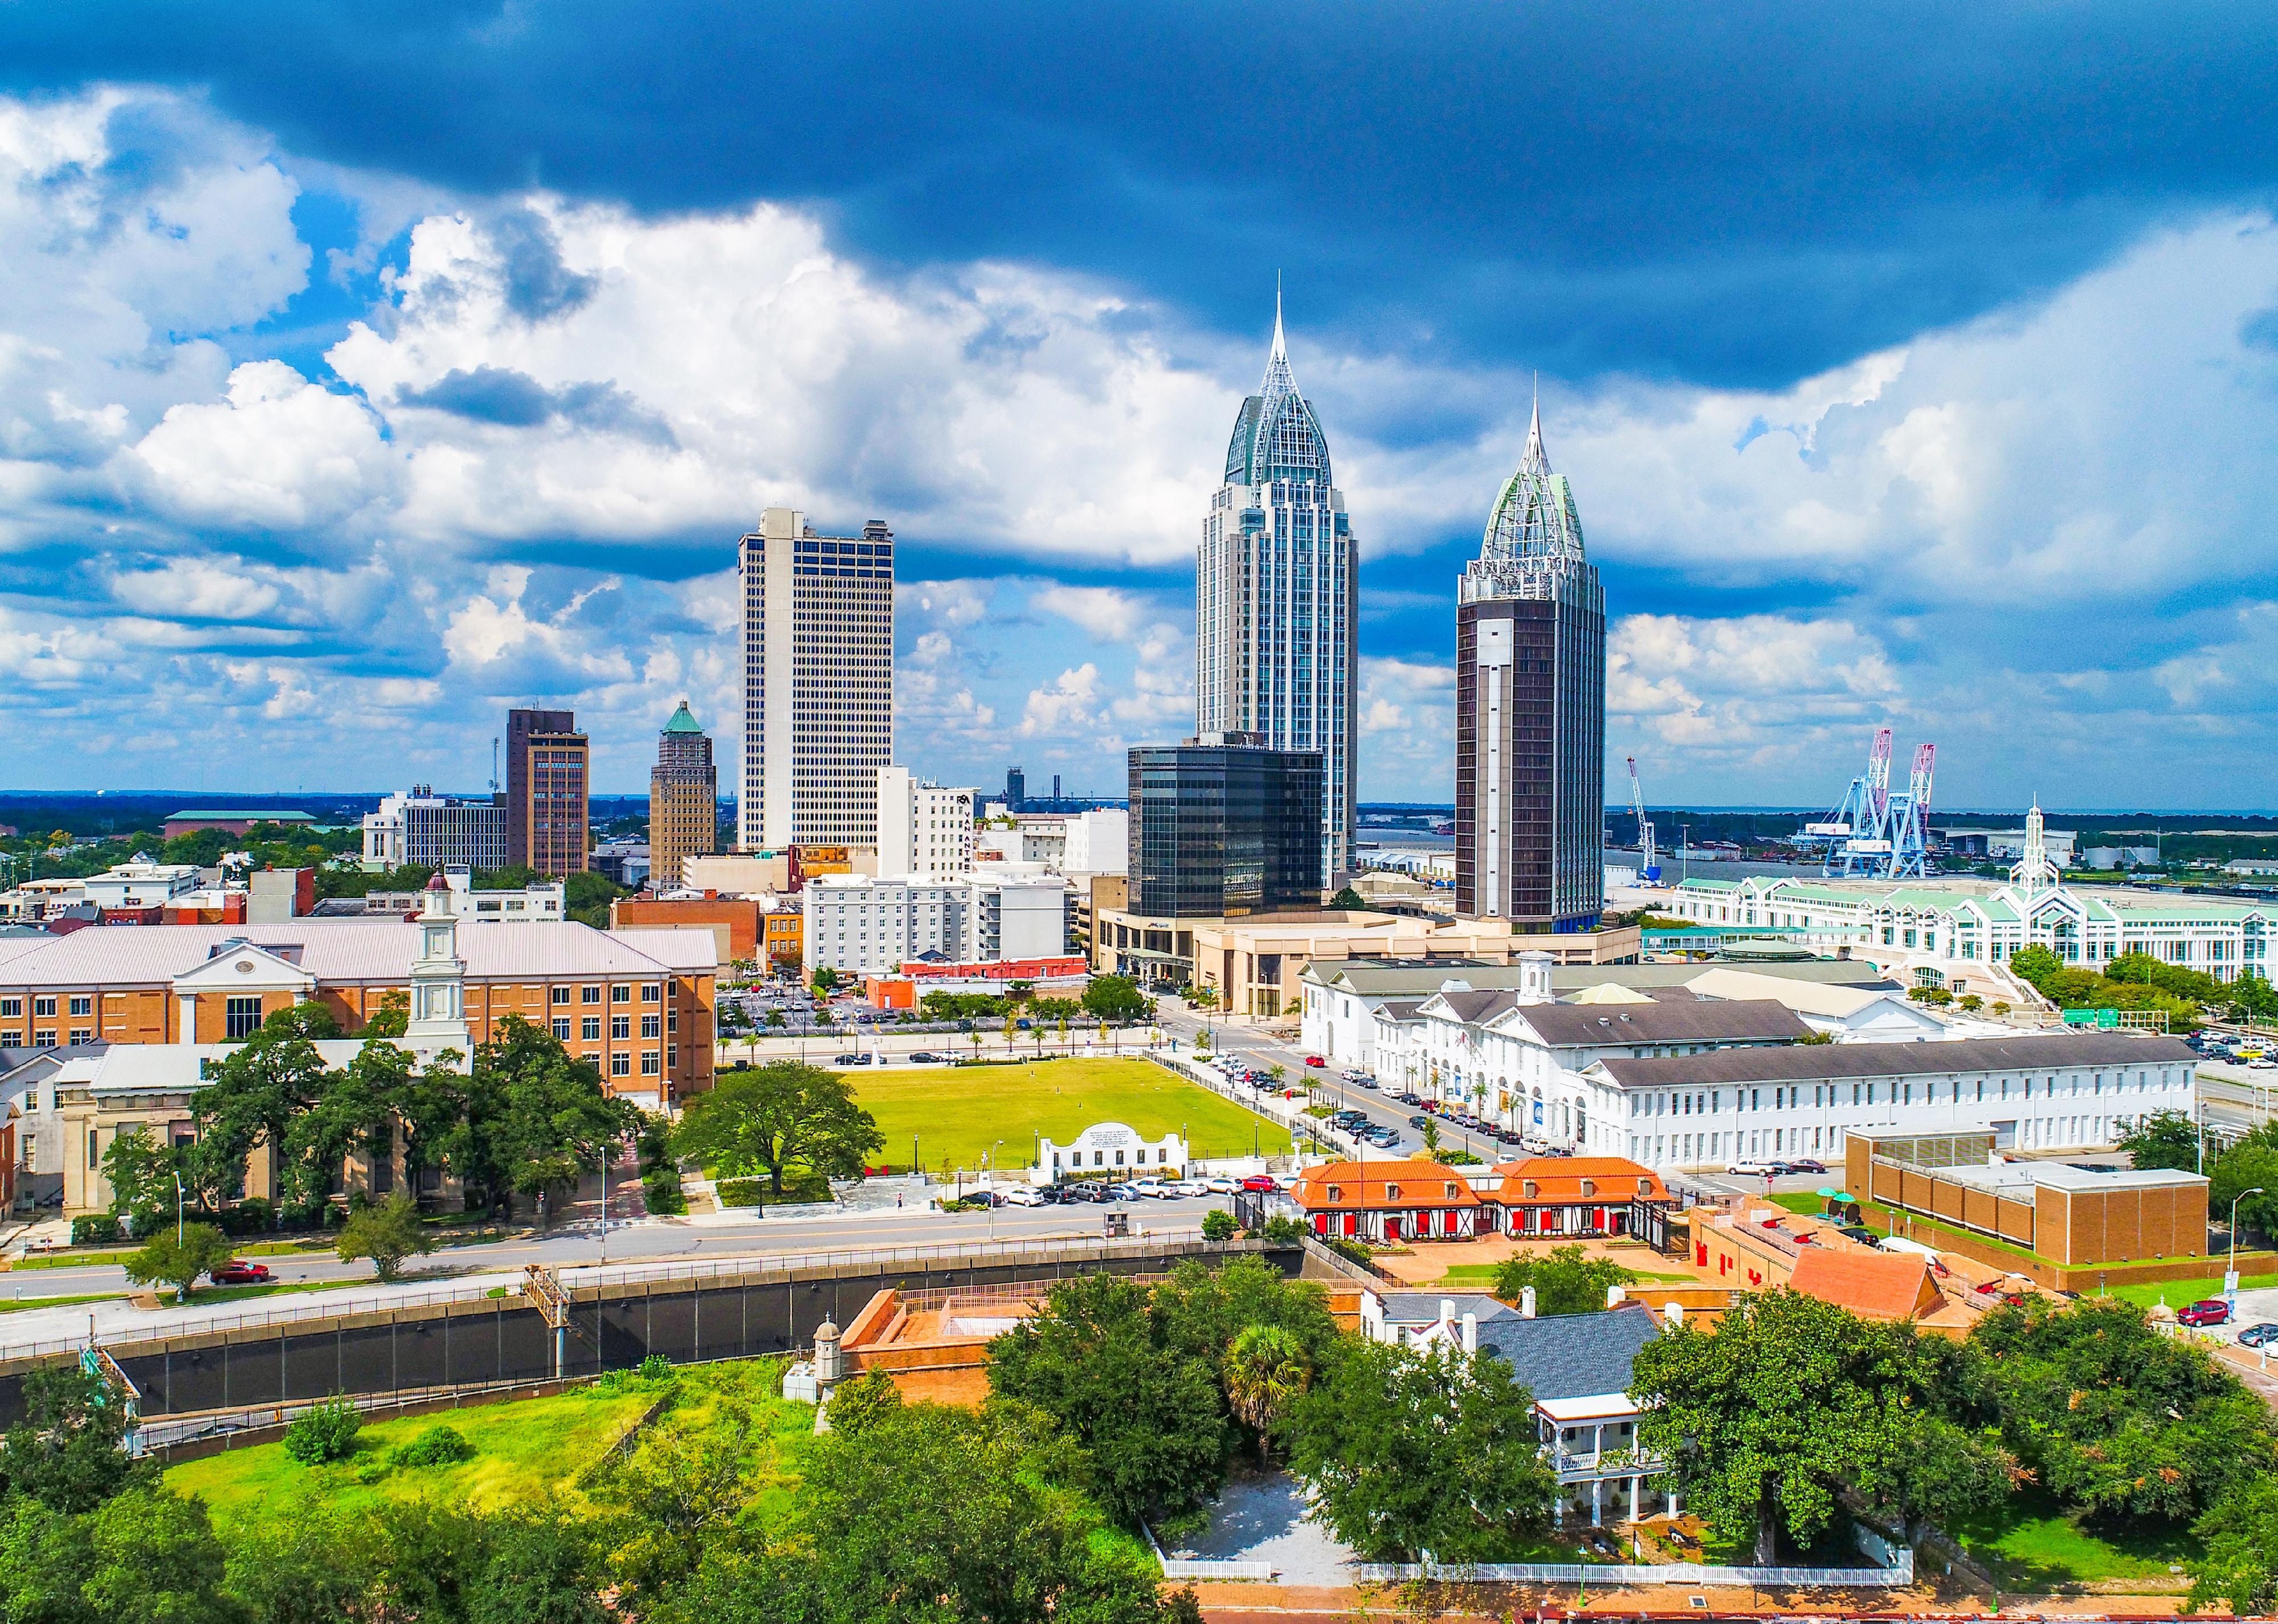
#48. Alabama
– Annual average property damage: $1.4 million
– Annual property damage per 100K people: $27,048.9
– Most damaging disaster type: Flash floods ($420,500 in annual damage)

f11photo // Shutterstock
#47. Washington DC
– Annual average property damage: $191,250
– Annual property damage per 100K people: $28,468.2
– Most damaging disaster type: Thunderstorm winds ($101,250 in annual damage)

f11photo // Shutterstock
#46. South Carolina
– Annual average property damage: $2.1 million
– Annual property damage per 100K people: $40,252.0
– Most damaging disaster type: Thunderstorm winds ($708,187 in annual damage)

Mihai_Andritoiu // Shutterstock
#45. New Jersey
– Annual average property damage: $4.5 million
– Annual property damage per 100K people: $49,080.3
– Most damaging disaster type: Thunderstorm winds ($3.5 million in annual damage)

Canva
#44. Georgia
– Annual average property damage: $6.1 million
– Annual property damage per 100K people: $55,683.0
– Most damaging disaster type: Hails ($2.7 million in annual damage)
Joseph Sohm // Shutterstock
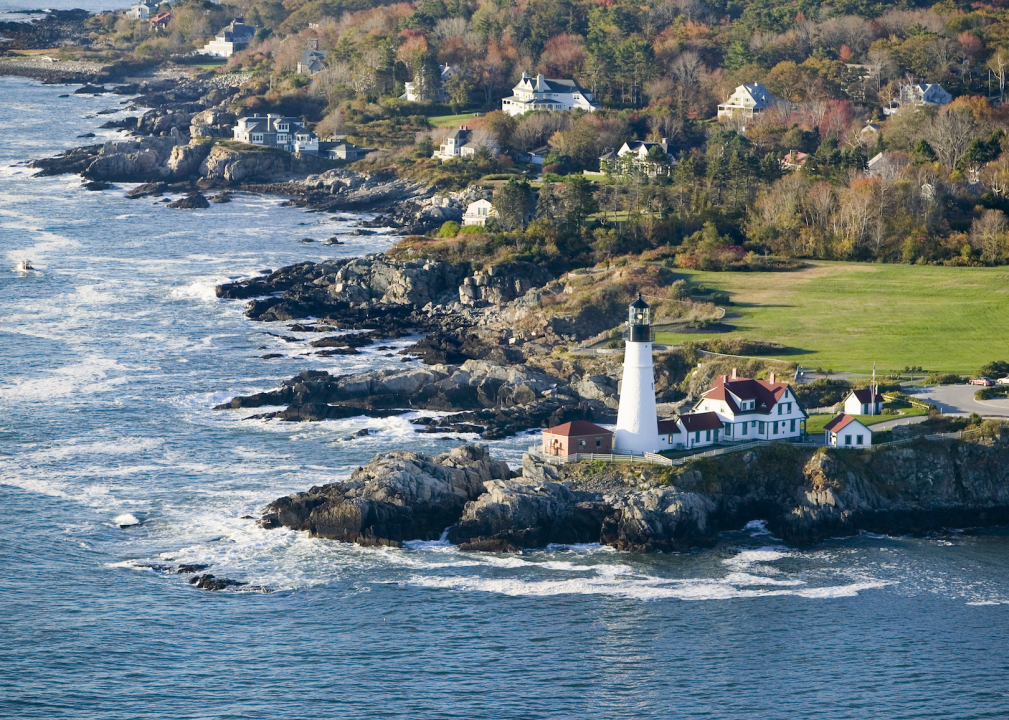
#43. Maine
– Annual average property damage: $775,300
– Annual property damage per 100K people: $55,964.6
– Most damaging disaster type: Flash floods ($421,400 in annual damage)

Mia2you // Shutterstock
#42. Florida
– Annual average property damage: $13.3 million
– Annual property damage per 100K people: $59,718.6
– Most damaging disaster type: Floods ($8.8 million in annual damage)

Canva
#41. Hawaii
– Annual average property damage: $874,600
– Annual property damage per 100K people: $60,727.8
– Most damaging disaster type: Flash floods ($860,000 in annual damage)

Sean Pavone // Shutterstock
#40. Maryland
– Annual average property damage: $5.1 million
– Annual property damage per 100K people: $83,333.1
– Most damaging disaster type: Flash floods ($2.9 million in annual damage)

ESB Professional // Shutterstock
#39. Pennsylvania
– Annual average property damage: $12 million
– Annual property damage per 100K people: $92,460.0
– Most damaging disaster type: Flash floods ($5.4 million in annual damage)

Sean Pavone // Shutterstock
#38. Massachusetts
– Annual average property damage: $6.7 million
– Annual property damage per 100K people: $96,208.8
– Most damaging disaster type: Flash floods ($3.2 million in annual damage)

Wangkun Jia // Shutterstock
#37. New York
– Annual average property damage: $25.3 million
– Annual property damage per 100K people: $128,352.4
– Most damaging disaster type: Flash floods ($15.8 million in annual damage)
Rotorhead 30A Productions // Shutterstock
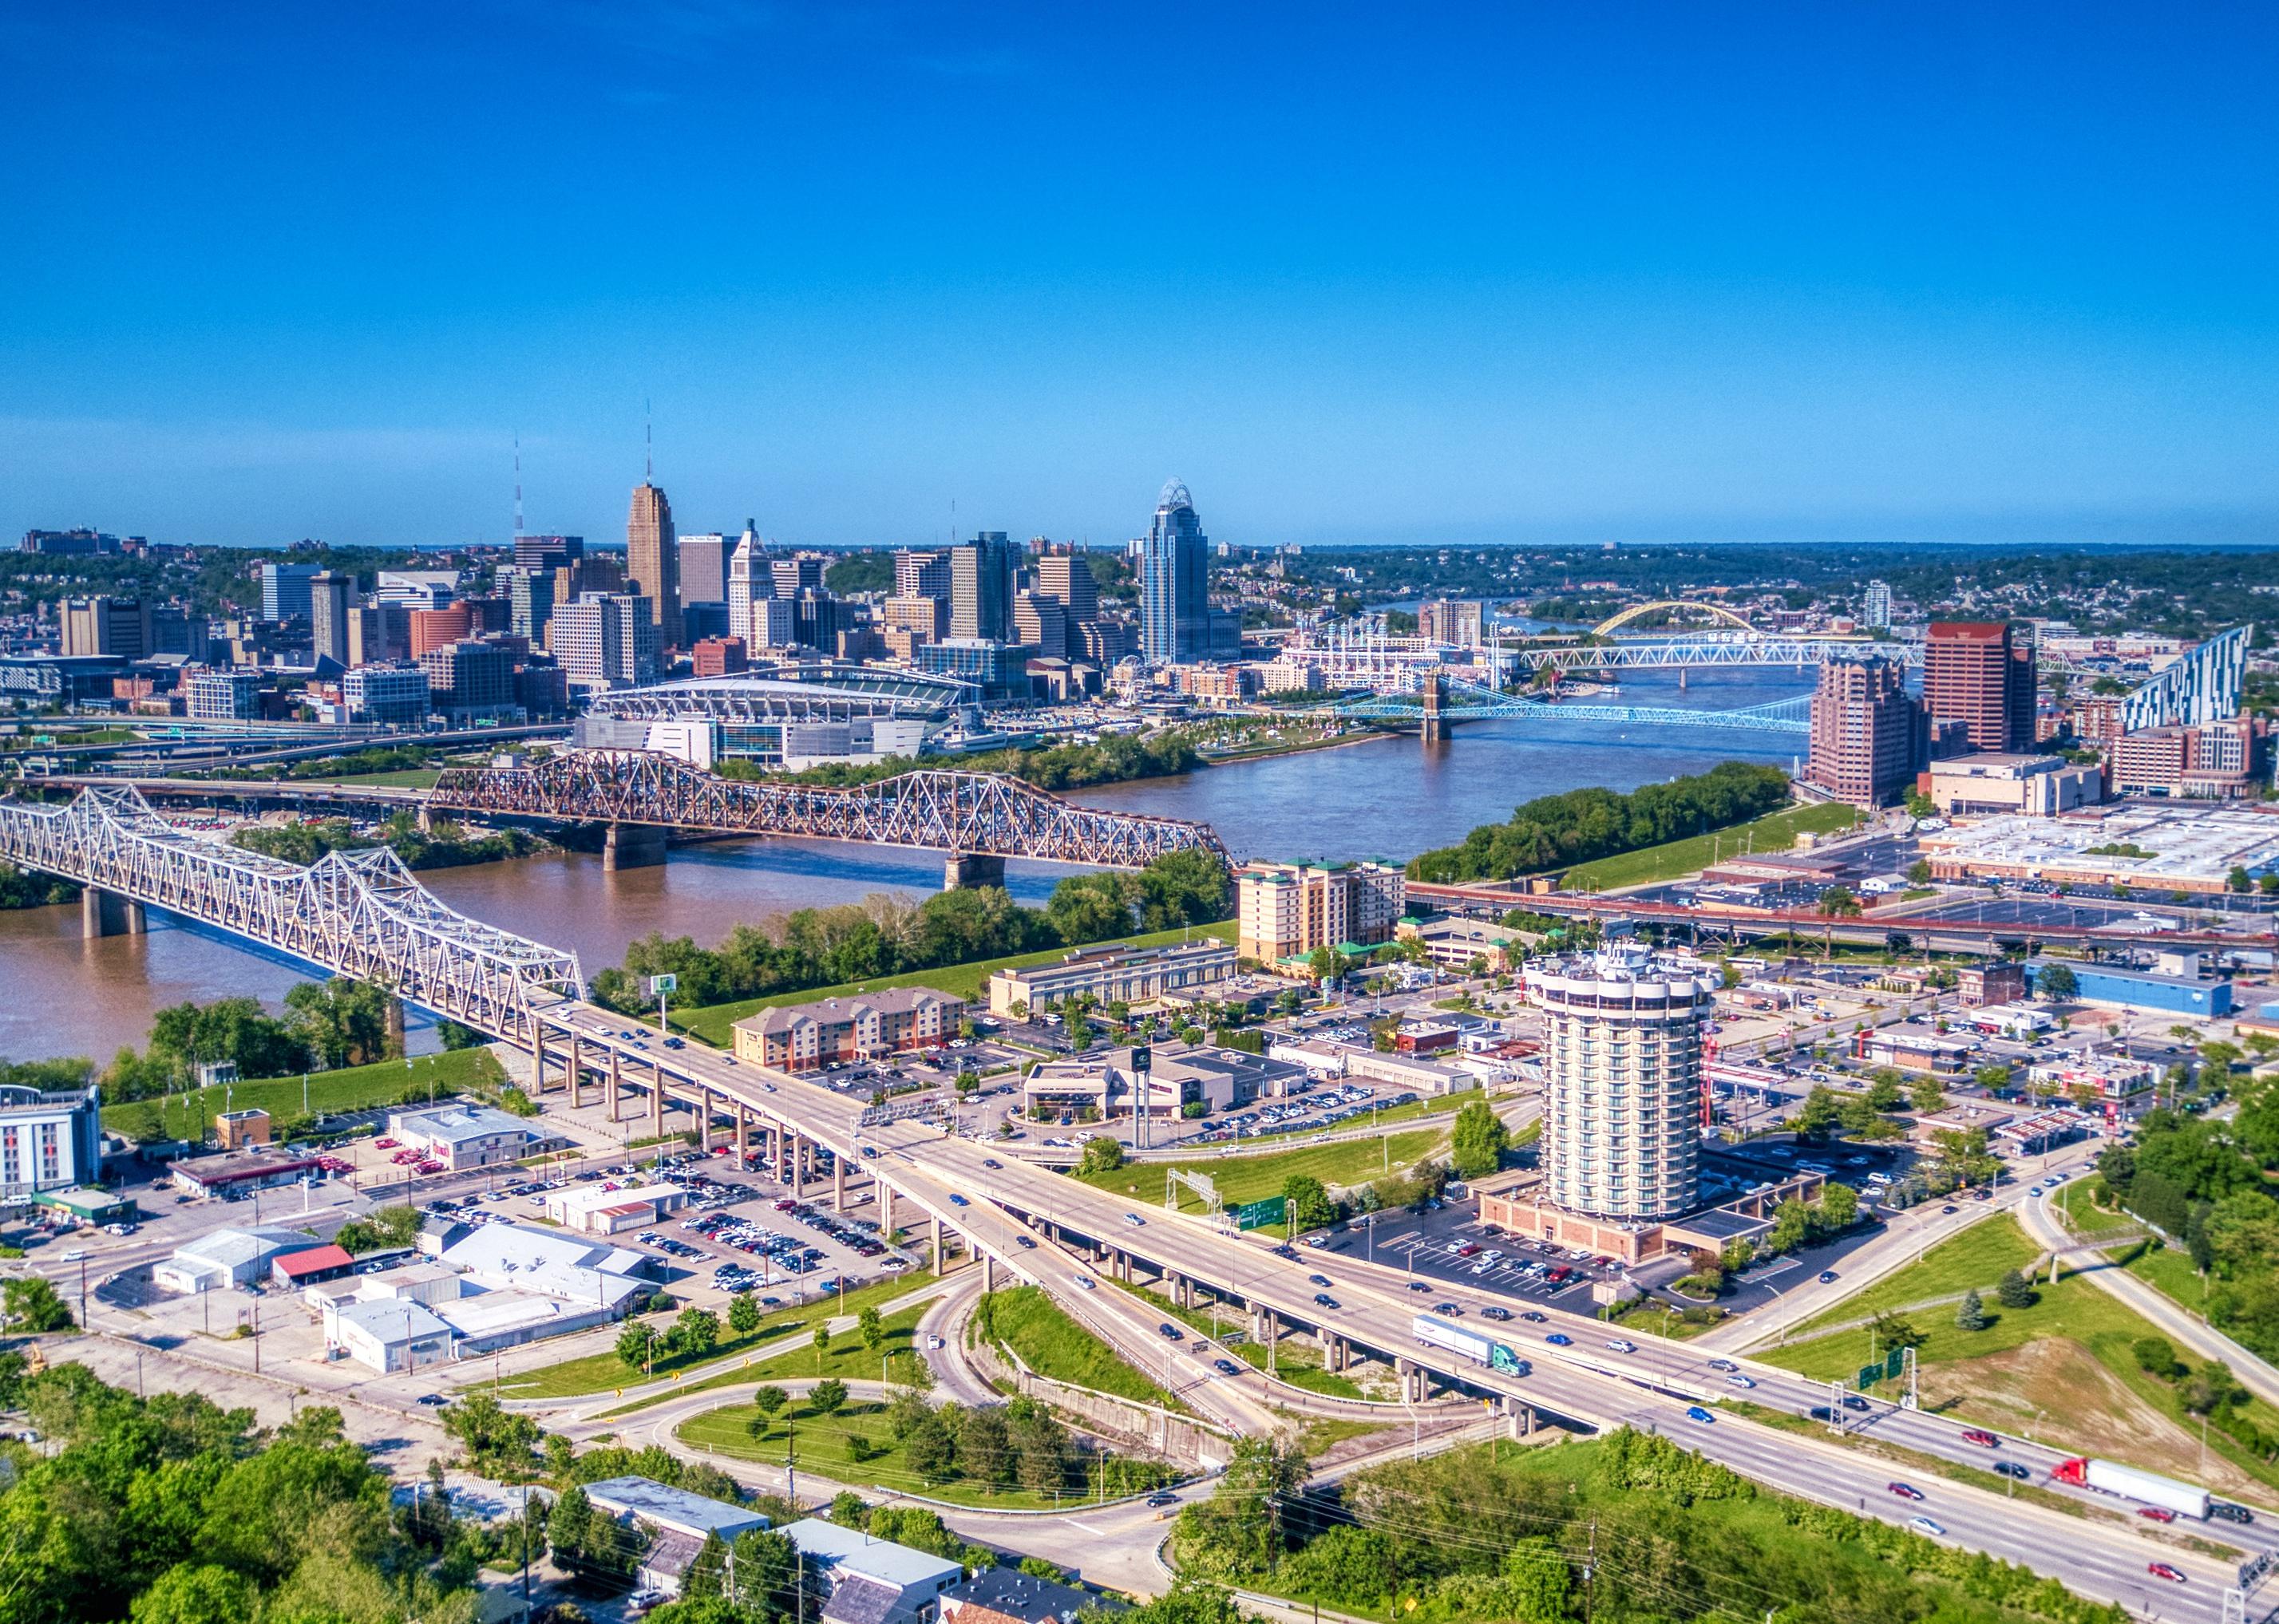
#36. Kentucky
– Annual average property damage: $6 million
– Annual property damage per 100K people: $132,199.7
– Most damaging disaster type: Flash floods ($3.1 million in annual damage)

Sean Pavone // Shutterstock
#35. Indiana
– Annual average property damage: $9.7 million
– Annual property damage per 100K people: $141,505.3
– Most damaging disaster type: Flash floods ($6.8 million in annual damage)

Canva
#34. Arkansas
– Annual average property damage: $4.6 million
– Annual property damage per 100K people: $152,112.0
– Most damaging disaster type: Thunderstorm winds ($1.8 million in annual damage)

Sean Pavone // Shutterstock
#33. Virginia
– Annual average property damage: $14.2 million
– Annual property damage per 100K people: $164,081.9
– Most damaging disaster type: Thunderstorm winds ($7.6 million in annual damage)

Sean Pavone // Shutterstock
#32. Connecticut
– Annual average property damage: $6.9 million
– Annual property damage per 100K people: $190,426.6
– Most damaging disaster type: Tropical storms ($5.4 million in annual damage)

Charles Knowles // Shutterstock
#31. Idaho
– Annual average property damage: $3.8 million
– Annual property damage per 100K people: $197,785.7
– Most damaging disaster type: Wildfires ($2.1 million in annual damage)

Canva
#30. Ohio
– Annual average property damage: $23.4 million
– Annual property damage per 100K people: $199,169.4
– Most damaging disaster type: Flash floods ($11.7 million in annual damage)

Sean Pavone // Shutterstock
#29. Oklahoma
– Annual average property damage: $8.1 million
– Annual property damage per 100K people: $201,365.0
– Most damaging disaster type: Tornados ($5.1 million in annual damage)

Mihai_Andritoiu // Shutterstock
#28. Montana
– Annual average property damage: $2.3 million
– Annual property damage per 100K people: $205,161.9
– Most damaging disaster type: Thunderstorm winds ($990,770 in annual damage)
Jacob Boomsma // Shutterstock
#27. Kansas
– Annual average property damage: $6.2 million
– Annual property damage per 100K people: $211,971.5
– Most damaging disaster type: Tornados ($2.9 million in annual damage)

Canva
#26. Mississippi
– Annual average property damage: $7.1 million
– Annual property damage per 100K people: $241,593.8
– Most damaging disaster type: Flash floods ($3.2 million in annual damage)

Sean Pavone // Shutterstock
#25. New Hampshire
– Annual average property damage: $3.4 million
– Annual property damage per 100K people: $242,909.6
– Most damaging disaster type: Flash floods ($3.3 million in annual damage)

randy andy // Shutterstock
#24. Nevada
– Annual average property damage: $7.8 million
– Annual property damage per 100K people: $246,272.5
– Most damaging disaster type: Hails ($5 million in annual damage)

Sean Pavone // Shutterstock
#23. Arizona
– Annual average property damage: $18.4 million
– Annual property damage per 100K people: $249,683.1
– Most damaging disaster type: Flash floods ($11 million in annual damage)

Canva
#22. Minnesota
– Annual average property damage: $16.7 million
– Annual property damage per 100K people: $291,812.0
– Most damaging disaster type: Floods ($4.5 million in annual damage)

Sharkshock // Shutterstock
#21. North Carolina
– Annual average property damage: $31.3 million
– Annual property damage per 100K people: $292,280.7
– Most damaging disaster type: Flash floods ($23.5 million in annual damage)

Sean Pavone // Shutterstock
#20. Illinois
– Annual average property damage: $38.7 million
– Annual property damage per 100K people: $307,761.7
– Most damaging disaster type: Flash floods ($25.6 million in annual damage)

Sean Pavone // Shutterstock
#19. New Mexico
– Annual average property damage: $6.6 million
– Annual property damage per 100K people: $310,509.1
– Most damaging disaster type: Flash floods ($3.5 million in annual damage)

Sean Pavone // Shutterstock
#18. Utah
– Annual average property damage: $11.7 million
– Annual property damage per 100K people: $345,543.5
– Most damaging disaster type: Wildfires ($6.2 million in annual damage)

Kevin Ruck // Shutterstock
#17. Tennessee
– Annual average property damage: $25.6 million
– Annual property damage per 100K people: $362,508.4
– Most damaging disaster type: Flash floods ($24 million in annual damage)

TommyBrison // Shutterstock
#16. Missouri
– Annual average property damage: $22.6 million
– Annual property damage per 100K people: $365,684.4
– Most damaging disaster type: Flash floods ($19.6 million in annual damage)
Canva
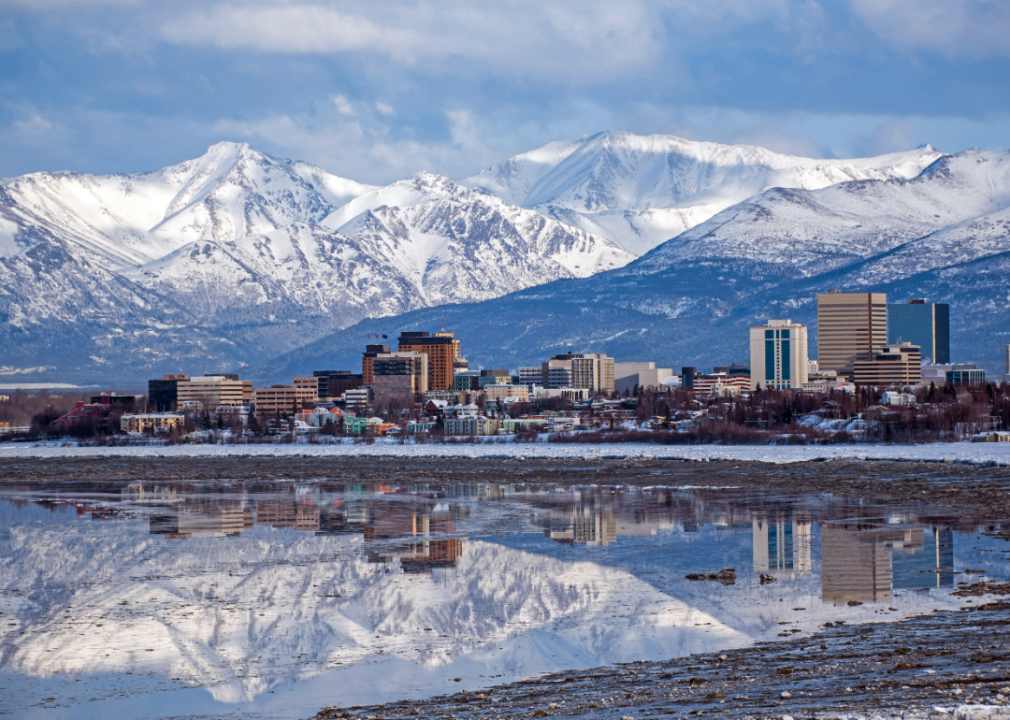
#15. Alaska
– Annual average property damage: $2.9 million
– Annual property damage per 100K people: $392,017.5
– Most damaging disaster type: Flash floods ($1.6 million in annual damage)

Marek Masik // Shutterstock
#14. California
– Annual average property damage: $184.4 million
– Annual property damage per 100K people: $472,492.5
– Most damaging disaster type: Wildfires ($164.5 million in annual damage)

Albert Pego // Shutterstock
#13. Vermont
– Annual average property damage: $3.1 million
– Annual property damage per 100K people: $479,434.8
– Most damaging disaster type: Flash floods ($2.2 million in annual damage)

Agnieszka Gaul // Shutterstock
#12. Washington
– Annual average property damage: $43.7 million
– Annual property damage per 100K people: $561,205.0
– Most damaging disaster type: Wildfires ($41.8 million in annual damage)

Mihai_Andritoiu // Shutterstock
#11. Wisconsin
– Annual average property damage: $42.9 million
– Annual property damage per 100K people: $727,551.5
– Most damaging disaster type: Flash floods ($14.5 million in annual damage)

LBill45 // Shutterstock
#10. Wyoming
– Annual average property damage: $4.7 million
– Annual property damage per 100K people: $801,438.0
– Most damaging disaster type: Floods ($2.7 million in annual damage)

Sean Pavone // Shutterstock
#9. West Virginia
– Annual average property damage: $21.7 million
– Annual property damage per 100K people: $1,223,132.8
– Most damaging disaster type: Flash floods ($11.6 million in annual damage)

JohnDSmith // Shutterstock
#8. South Dakota
– Annual average property damage: $11.2 million
– Annual property damage per 100K people: $1,233,768.3
– Most damaging disaster type: Hails ($7.3 million in annual damage)

Jacob Boomsma // Shutterstock
#7. Iowa
– Annual average property damage: $49.5 million
– Annual property damage per 100K people: $1,546,090.2
– Most damaging disaster type: Tornados ($33.8 million in annual damage)
Katherine Welles // Shutterstock
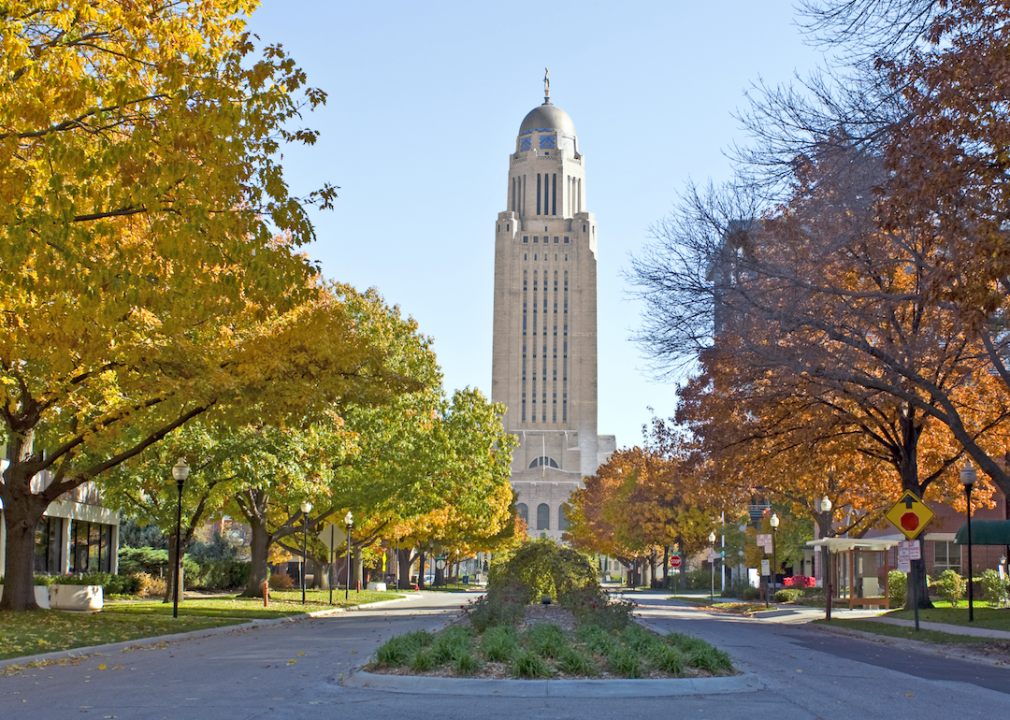
#6. Nebraska
– Annual average property damage: $32.2 million
– Annual property damage per 100K people: $1,636,407.8
– Most damaging disaster type: Thunderstorm winds ($12.7 million in annual damage)

Canva
#5. Colorado
– Annual average property damage: $113.3 million
– Annual property damage per 100K people: $1,940,924.7
– Most damaging disaster type: Hails ($61.8 million in annual damage)
Jacob Boomsma // Shutterstock
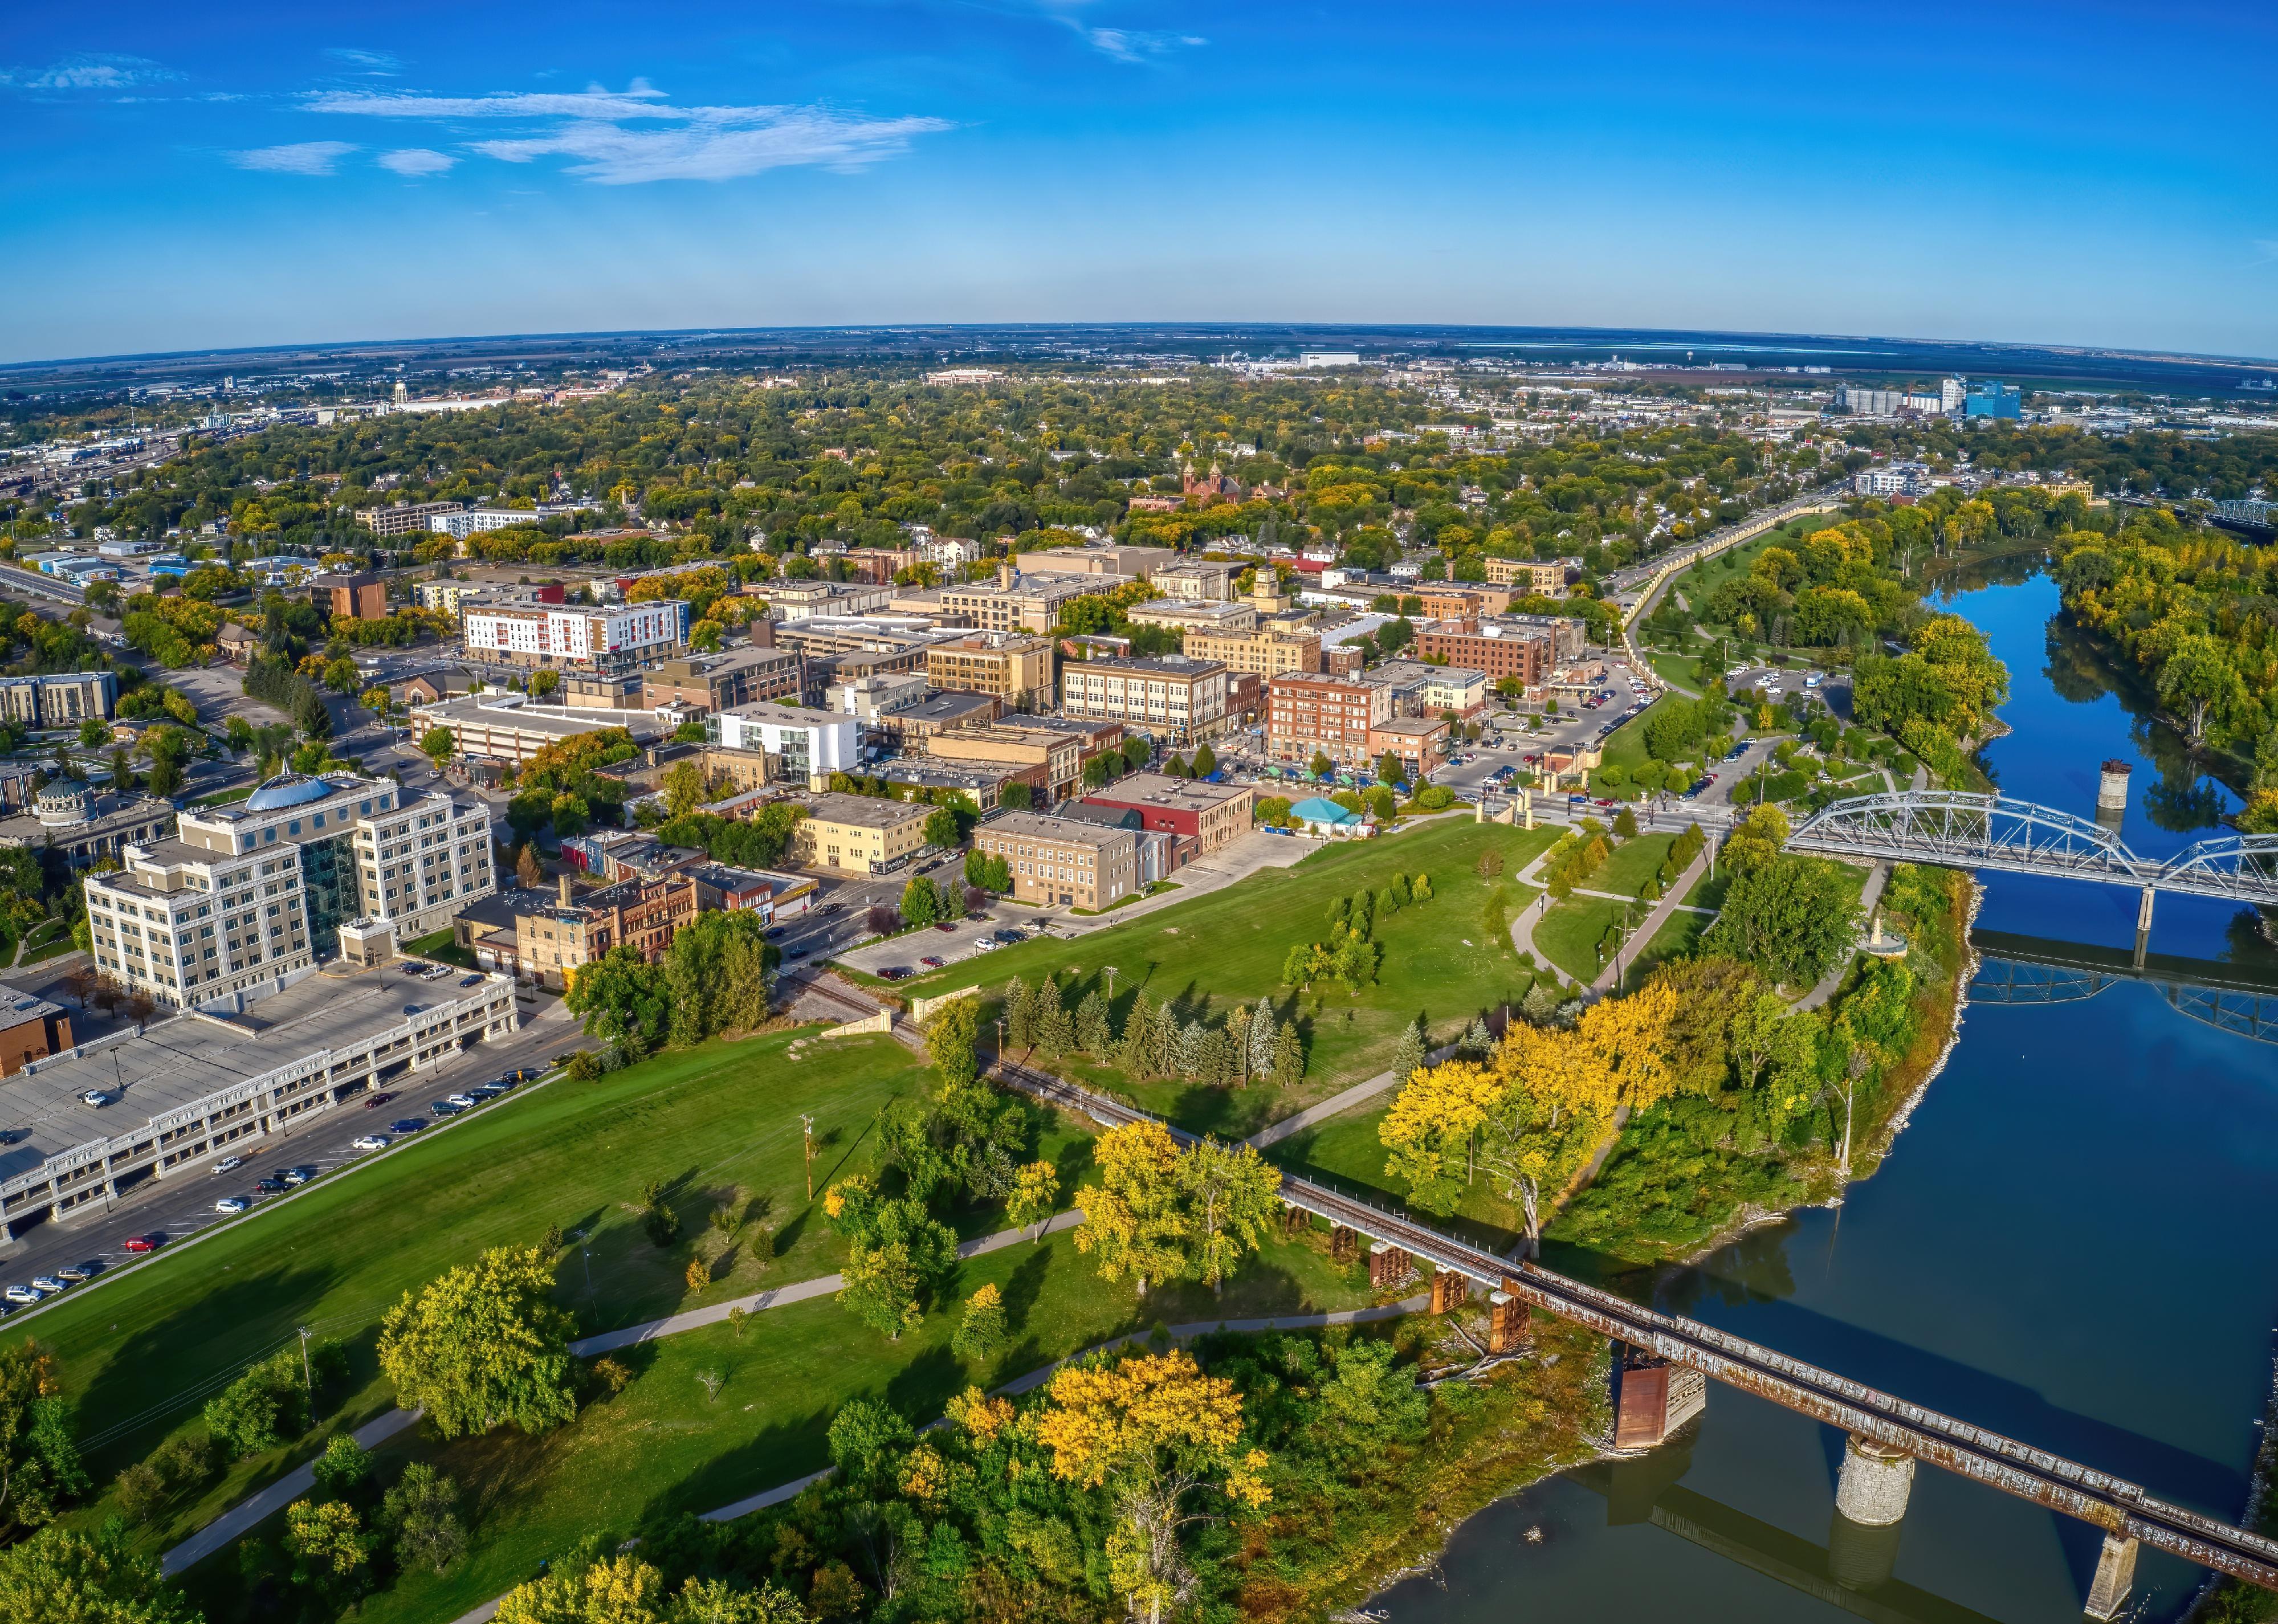
#4. North Dakota
– Annual average property damage: $15.4 million
– Annual property damage per 100K people: $1,976,917.9
– Most damaging disaster type: Hails ($8.7 million in annual damage)

Sean Pavone // Shutterstock
#3. Michigan
– Annual average property damage: $246.1 million
– Annual property damage per 100K people: $2,452,509.6
– Most damaging disaster type: Flash floods ($218.3 million in annual damage)

Sean Pavone // Shutterstock
#2. Texas
– Annual average property damage: $5.6 billion
– Annual property damage per 100K people: $18,564,520.8
– Most damaging disaster type: Flash floods ($4.5 billion in annual damage)

Sean Pavone // Shutterstock
#1. Louisiana
– Annual average property damage: $3.2 billion
– Annual property damage per 100K people: $69,646,412.5
– Most damaging disaster type: Hurricanes ($1.9 billion in annual damage)
Data reporting by Emma Rubin. Story editing by Brian Budzynski. Copy editing by Paris Close.
[ad_2]
Source link